


本文使用的系统为 Arch Linux 部分包可能在您的系统不存在 / 低版本
安装 Prometheus 和 Grafana
sudo pacman -S prometheus grafana配置 Grafana
1) 由于 Prometheus 的默认配置足够监控本机,因此不进行配置,但仍放出配置文件
# my global config
global:
  scrape_interval: 15s # Set the scrape interval to every 15 seconds. Default is every 1 minute.
  evaluation_interval: 15s # Evaluate rules every 15 seconds. The default is every 1 minute.
  # scrape_timeout is set to the global default (10s).

# Alertmanager configuration
alerting:
  alertmanagers:
    - static_configs:
        - targets:
          # - alertmanager:9093

# Load rules once and periodically evaluate them according to the global 'evaluation_interval'.
rule_files:
  # - "first_rules.yml"
  # - "second_rules.yml"

# A scrape configuration containing exactly one endpoint to scrape:
# Here it's Prometheus itself.
scrape_configs:
  # The job name is added as a label `job=<job_name>` to any timeseries scraped from this config.
  - job_name: "prometheus"

    # metrics_path defaults to '/metrics'
    # scheme defaults to 'http'.

    static_configs:
      - targets: ["127.0.0.1:9090"]
2) 启动服务
sudo systemctl enable prometheus grafana --now3) 登陆 Grafana
地址为 :3000 ,默认帐号密码 admin/admin 登陆会有要求设置新密码
4) 添加图表
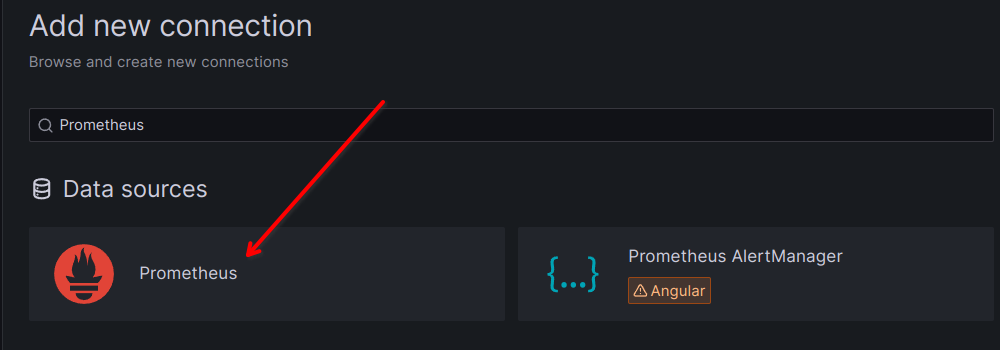
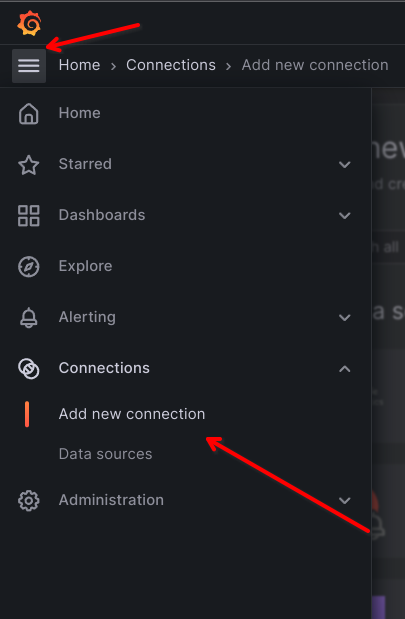 在登陆后点击 Add new connection 搜索到 Prometheus
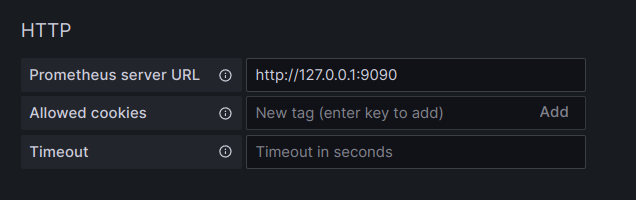
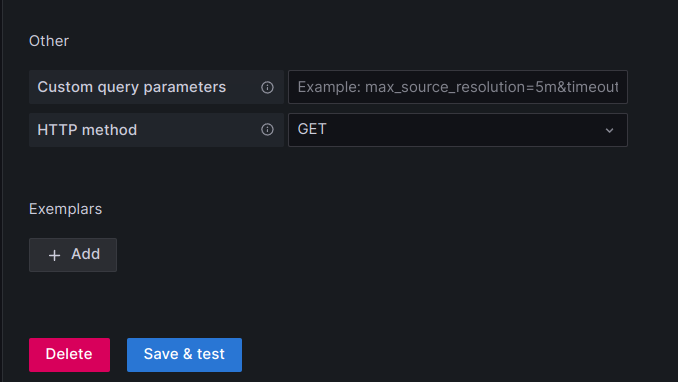
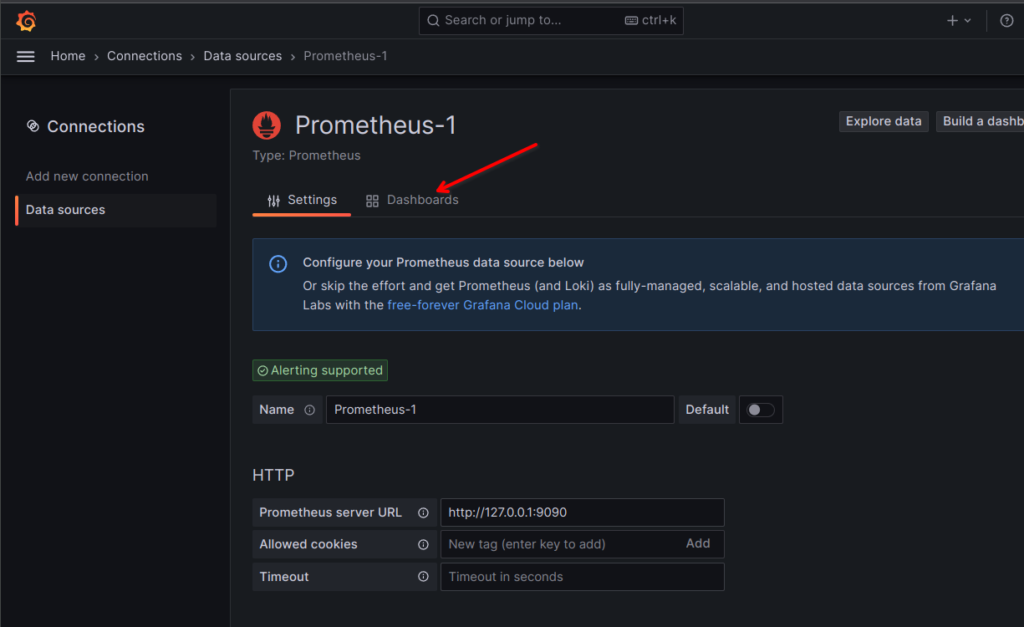
 进入后点击 Add new data source ,在 HTTP 栏填入 http://127.0.0.1:9090 即 Prometheus 监听地址,在 Other 中更改 HTTP method 从 POST 改为 GET,最后点击 Save & test
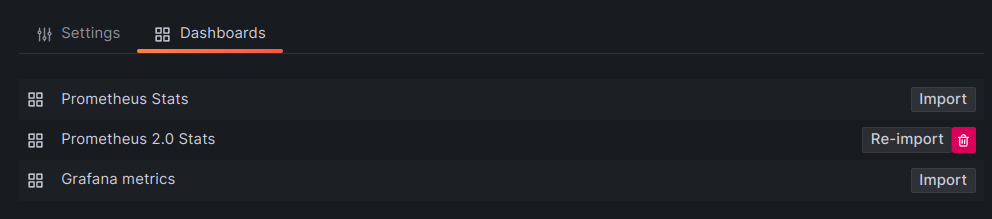
 保存后点击最上方的 Dashboards,从三个中随便选一个导入
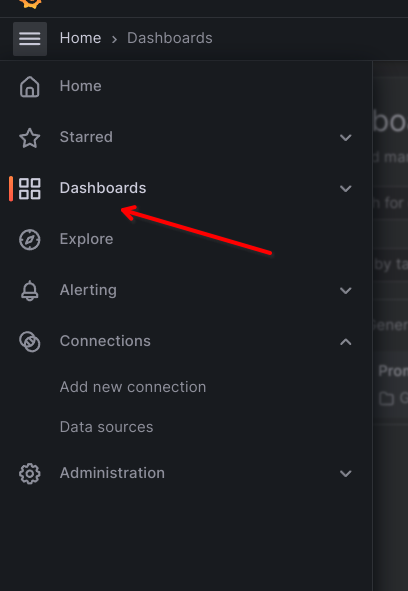
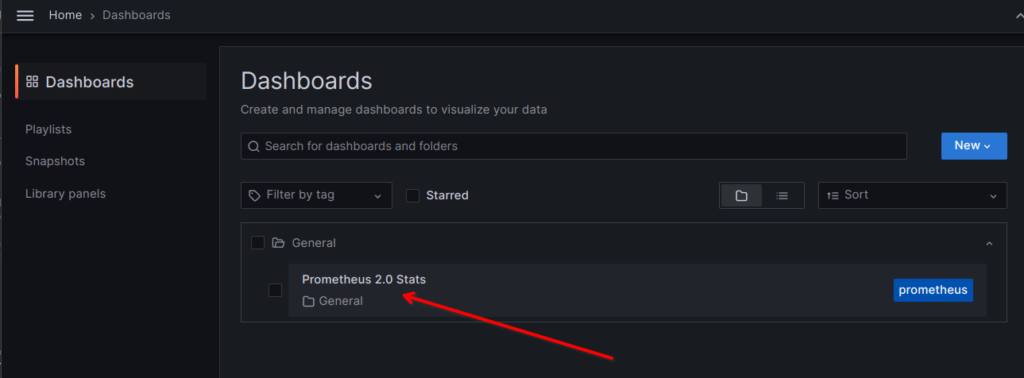
 回到 Dashboards 即可查看监控
评论区